1.下图黄色标记的地方,属于tooltip(提示框组件)
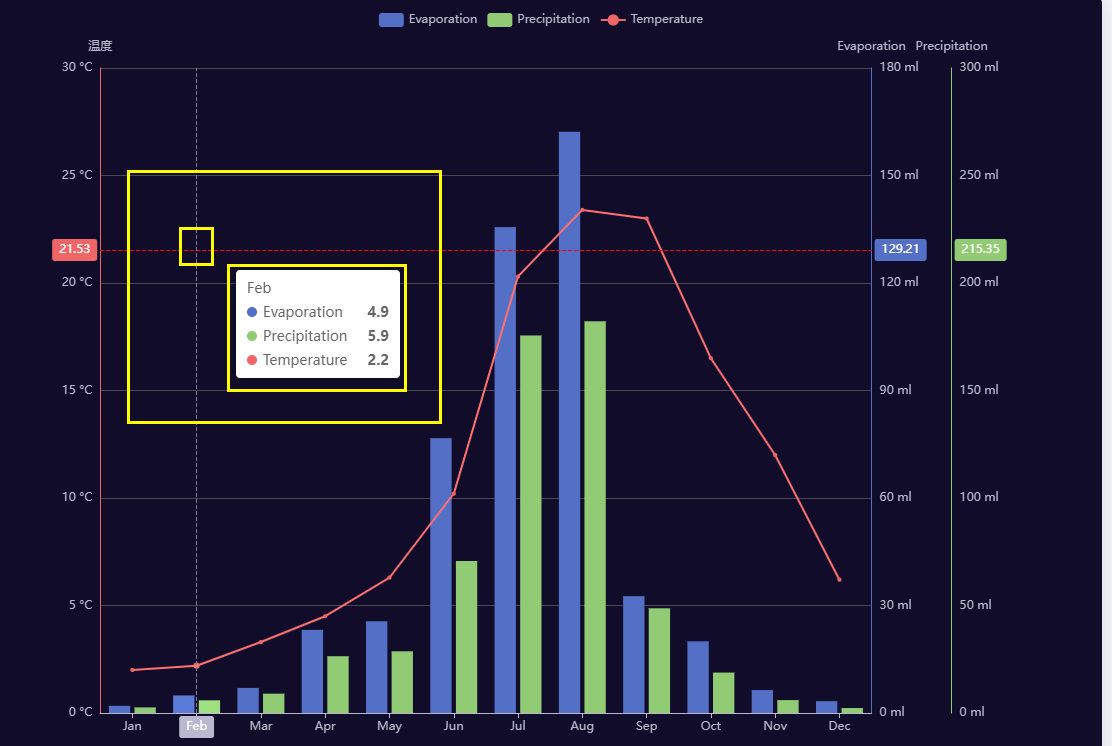
tooltip.axisPointer是图中的小”十字“,还有其他的方式
'line'直线指示器'shadow'阴影指示器'none'无指示器'cross'十字准星指示器。其实是种简写,表示启用两个正交的轴的 axisPointer。
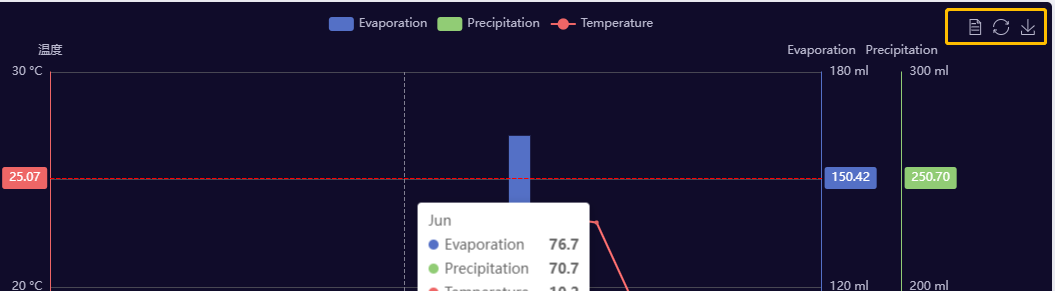
2.下图黄框部分是 toolbox(工具栏),内置有导出图片,数据视图,动态类型切换,数据区域缩放,重置五个工具。
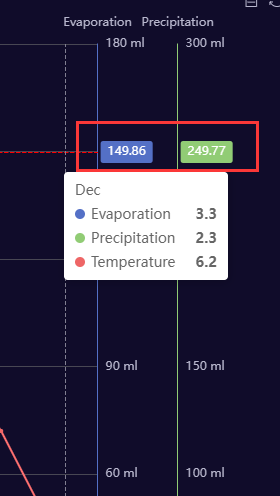
3. 下图红色框部分是yAxis
 yAxis: [
    {
      type: 'value',
      name: 'Evaporation',
      position: 'right',
      alignTicks: true,
      axisLine: {
        show: true,
        lineStyle: {
          color: colors[0]
        }
      },
      axisLabel: {
        formatter: '{value} ml'
      }
    }
颜色是axisLine(坐标轴轴线相关设置),其中的lineStyle表示线条颜色。
4.下面红色框是legend(图例组件)
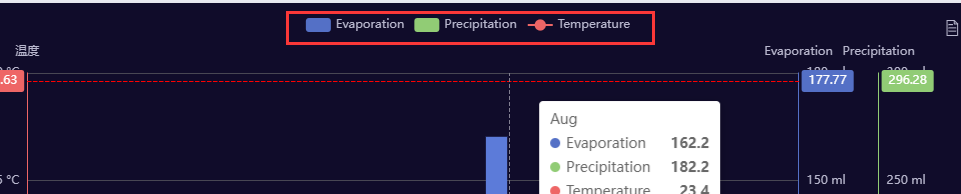
当图例数量过多时,可以使用 滚动图例(垂直) 或 滚动图例(水平),参见:legend.type